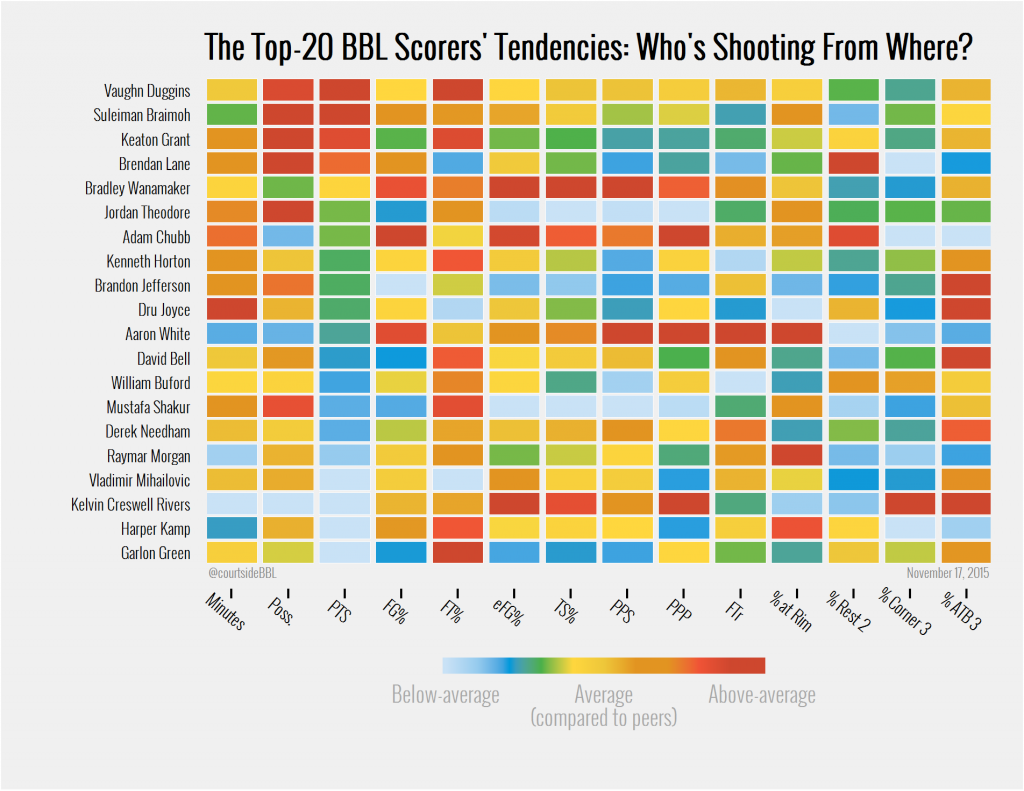
Just a quick intro to the following chart: I tried a new approach which might, at first sight, seem counter-intuitive. However, if you care enough to try to orientate yourself for a moment, it does hold a lot of information. I’ll try to give some examples below, but am in kind of a hurry (Alba game tonight).
First of all, here’s the chart:

The Top-20 BBL Scorer’s Tendencies: Who’s Shooting (Efficiently) From Where?
To clarify the abbreviations: On the x-axis, that’s Minutes, Possessions, Points per Game, FG%, FT%, eFG%, TS%, then Points Per Shot, Points per Play/Possession, Free-throw rate (as in how many free-throws does a players shoot for every field goal attempt he takes; look at Aaron White, he’s crazy), followed by how many of a player’s shots come from the restricted area (% at Rim), everything outside the restricted area, but inside the arc (% Rest 2), from the cornes (% Corner 3), and from above-the break (% ATB 3).
Continue reading →
Just a quick intro to the following chart: I tried a new approach which might, at first sight, seem counter-intuitive. However, if you care enough to try to orientate yourself...
In 
 jannes at court-side.de


