
 jannes at court-side.de


After I visualised the shot charts for the first-round matchups, I wanted to do the semi-finals, too. Here’s the image followed by some notes on every team:¹
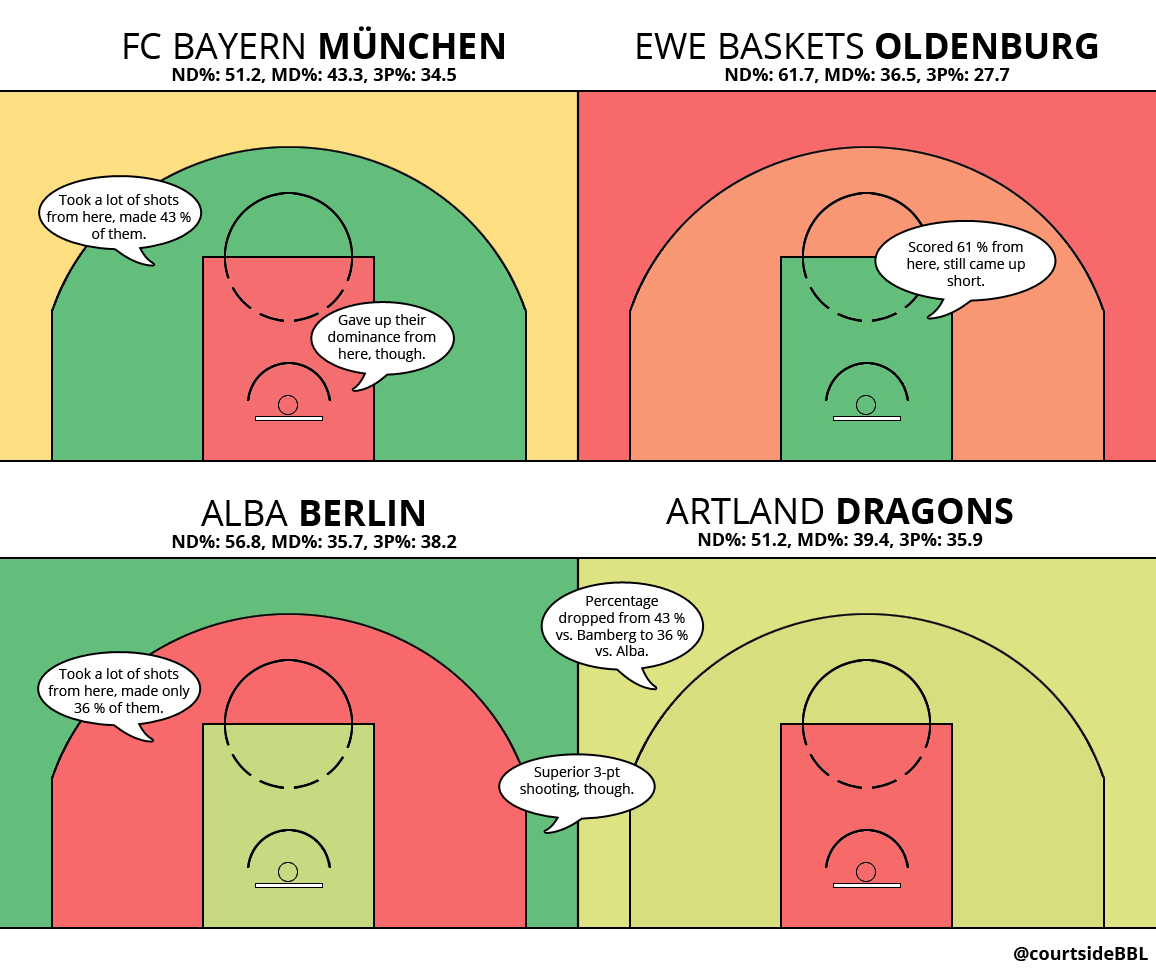
As for Bayern: Oldenburg held them away from the basket, forcing bad shots and taking away their dominance in the paint. They responded with a mid-range heavy shooting output which suits them just as well with their Big Men’s (especially Thompson’s and Bryant’s) soft touches and Heiko Schaffartzik and Malcolm Delaney hitting shots from everywhere on a regular basis in the semi-finals.
Oldenburg, on the other hand, were forced to take a lot of threes which they shot better than in the first round, but still way beyond their Regular Season average (39.3 %). They made over 60 % of their shots in the paint with Adam Chubb doing what he does best, Rickey Paulding going to the rim in Game 3 and their fast guards exploding to the basket. Still wasn’t enough.
Alba, just like Bayern, took a big load of shots from mid-range, often times lacking creativity vs. Artland’s clever man-to-man defenders. Only they didn’t shot as well as Bayern did. They did, however shot a good percentage on threes, though they took a lot less then they did in the first round vs. Ulm.
Artland killed Bamberg from three, making a tremendous 43 % from long range. Berlin found a way to take those shots away, just like they did in the quarter-finals vs. Ulm. Artland hit just 36 % on threes in the semis, not enough for another upset.
Bayern-Alba in the Finals.
¹ The colors range from a dark green (really good) over yellow (mediocre) to a dark red (really bad), always compared to the rest of the playoff teams in the semi-finals. Shooting locations as available in the official Beko BBL play-by-plays.