
 jannes at court-side.de


Season’s over, Bayern take the Finals in four games. I wouldn’t say Alba came closest to beating Bayern these playoffs, as Oldenburg fought them over five games and actually caused a lot more trouble for Bayern’s offense. But Alba did come close and had to deal with a Bayern team that stepped up their game when it mattered most.
Anyways, I’ve done it for the first-round and second-round matchups, so here’s the Shot Charts for the Finals between Bayern München and Alba Berlin.¹
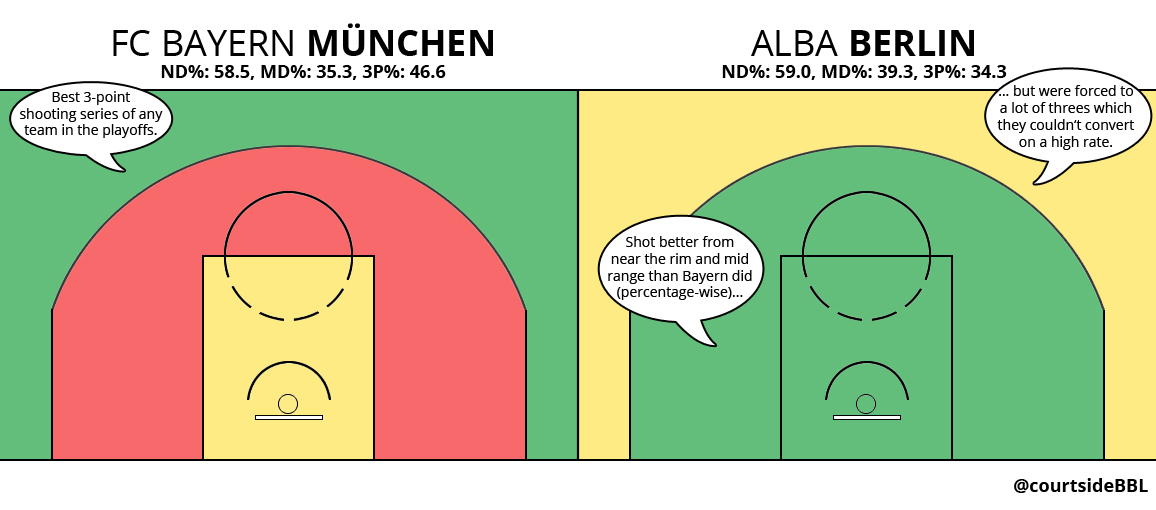
Shot Charts for the 2013/2014 Beko BBL Finals. (All numbers per June 19, 2014)
Alba did shoot slightly better percentages in the paint and from mid range, the latter especially due to Radosevic’ deadly shot from the elbow. (He alone went 13-for-18 from mid range in the Finals). But Bayern packed the paint and forced Alba to take a lot of threes, way more than they usually take. Those shots Alba coulnd’t convert on a high-enough level.
Bayern, on the other hand, shot a playoff-best 46.6 % from three-point land, no team shot a higher percentage over a series in the playoffs (let alone over the Regular Season). Finals MVP Malcolm Delaney at 8-for-19 (42.1 %), Bryce Taylor at 9-for-17 (52.9 %), and Heiko Schaffartzik at 8-for-15 (53.3 %): It’s tough to beat a team that’s as hot from beyond the arc as Bayern was.
¹ The colors range from a green (better than the opponent and better than all teams’ playoff averages) over yellow (worse than the opponent but still better than the averag) to red (below-average and worse than the opponent). Shooting locations as available in the official Beko BBL play-by-plays.
Pingback: Playoffs 2014: Statistische Aufbereitung der Finals | court-side.de()