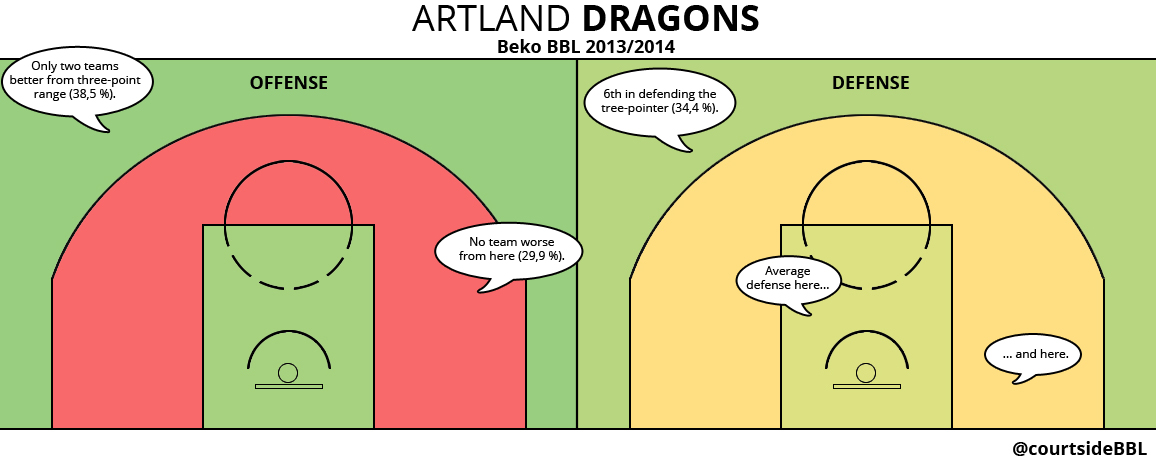
Obviously, these shot charts look nothing like Kirk Goldsberry’s. We don’t really have specific shooting locations available for BBL teams, certainly not for players. (We got this here, you decide for yourselves whether you find it useful.)
I still wanted to experiment a little, so what I did here is simply seperating the shot chart into shooting percentags from near-distance, from mid-range, and from 3-point land (as available in Beko BBL’s play-by-play). The colors range from a dark green (really good) over yellow (mediocre) to a dark red (really bad), always compared to the rest of the league.
Take Artland as my first try:

 jannes at court-side.de


