Obviously, these shot charts look nothing like Kirk Goldsberry’s. We don’t really have specific shooting locations available for BBL teams, certainly not for players. (We got this here, you decide for yourselves whether you find it useful.)
I still wanted to experiment a little, so what I did here is simply seperating the shot chart into shooting percentags from near-distance, from mid-range, and from 3-point land (as available in Beko BBL’s play-by-play). The colors range from a dark green (really good) over yellow (mediocre) to a dark red (really bad), always compared to the rest of the league.
Take Artland as my first try:

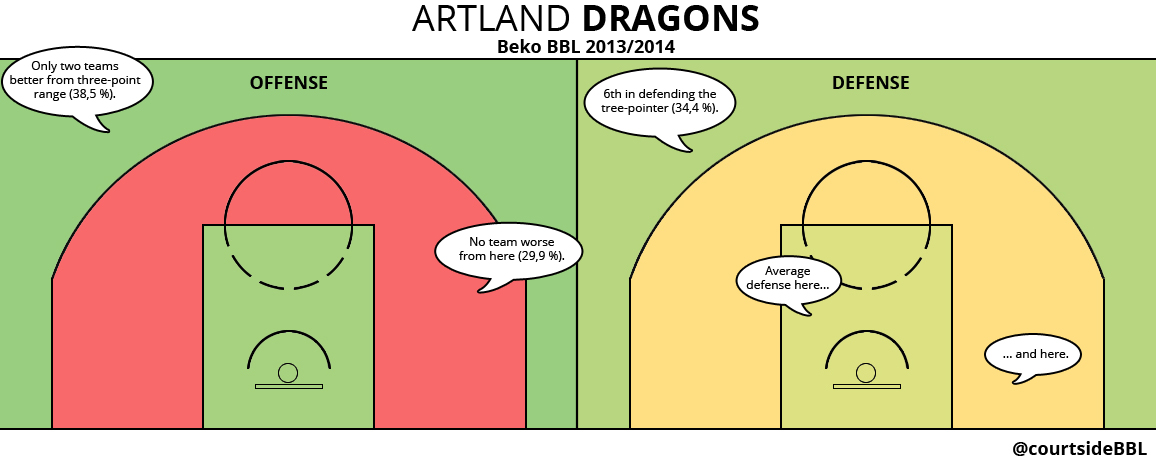
Artland Dragons’ Shot Charts for the 2013/2014 Beko BBL Season. (All numbers per Apr. 5, 2014, 28 games played.)
Few words concerning Artland’s offensive output:
3-Point Shooting:
This comes first, because Artland Dragons are a really good 3-point shooting team. Lawrence Hill is shooting 50.5 % from three-point land for the season (47-93 3P), which is insane. Topper is at 41.5 % (44-106 3P), and they have two more guys in Bastian Doreth and Guido Grünheid shooting above 40 % (three, if you count Anthony King’s 2-5 3P). As a team, this puts Artland into 3rd place in 3P% behind only Oldenburg and Bayern.
Mid-Range Shooting:
Now, this is where they are not really good at. Artland take 16.4 % of their shots from mid-range, that’s above-average. Only 5 teams take a higher number of shots from that distance compared to their overall field goal attempts. Which wouldn’t be too bad, if the Dragons showed some good shooting percentages from that distance (like Berlin for example). But, actually, no team shoots worse from here: League-average is 37.3 %, Dragons shoot a lowsy 29.9 %.
Near-Distance Shooting:
Statistically, you want a lot of shots from near the basket. Now, Anthony King and Kenneth Frease (Artland’s Centers) are not those kind of players that carry you on offense. Other bigs like Hill or Grünheid might rather take the three than going inside. So, the Dragons don’t go there as often as other teams do: 45.1 % of all field goal attempts they take come from the area between the basket and the free-throw line (again: according to the official Beko BBL play-by-play data). That’s below-average, only Braunschweig, Vechta, and Würzburg take less of those “easy” shots.

 jannes at court-side.de


Pingback: Shot Charts: Brose Baskets | court-side.de()